Roadmap
Canopsis Roadmap
Focus on the evolution of the solution
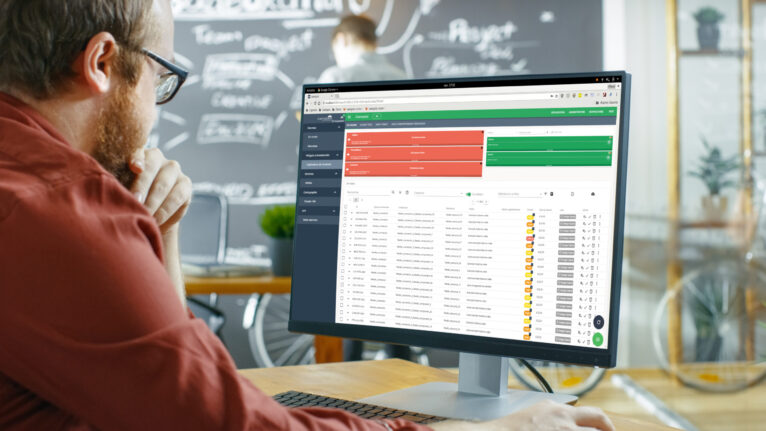
Canopsis roadmap is divided into 7 topics:


Intelligence and Machine Learning
Deduction
Automatic correlation
Automatically identify and group alarms
automatic remediation
To be able to execute instructions without human intervention
KPI / Return on Investment
Know the real cost of an alarm
Steering experience
Intervene in a more reactive way thanks to the machine experience
Contextualization
Alarm categorization
Qualify alarms via recognition system
Anomaly detection
Identify a malfunction by comparing periods
Crisis scenarios
Anticipate an incident based on warning signs
Data source learning
Detect changes that could be anomalies via machine learning
Ops Assistant
Chatbot agent
Interact with a virtual conversation / chatbot agent
ChatOps agent
Facilitate the creation and validation of rules, while still having a requesting agent

Components and repositories
Alarms
Alarm correlation
Identify root causes and impacts
Dependency trees
Graphically represent IS dependencies
Flapping
Identify alarms with fluctuating status
Idle rules
Manage Canopsis information source lifelines
Labels
Customize alarms with labels / tags
Link generator
Associating links with an entity or an alarm
Scheduled actions
Give a given alarm several actions
Enrichment
Enrichment
Enrich IS events as they arrive in Canopsis
Import repositories
Improving data import into Canopsis
Miscellaneous
Data synergy with data sources
Enriching data sources
Event filter
Sort events as they enter Canopsis
Graphic themes
Manage and apply a theme to the Canopsis graphic interface
Planning
Define monitoring periods and take into account changes impacting the operation
Remediation
Get automatically the most appropriate resolution method.
Ticketing
Manage the ticket creation process directly in Canopsis using the ticketing module !

Metrology
Entity SLI
Calculate uptime and downtime for each entity
Metrics export
Metrics export in Prometheus format for transmission to other tools
Metrics reception
Be able to receive metrics from third-party data sources
Service Level Agreement / SLA
Define and monitor compliance with contractual commitments with users
Temporal analysis
Provide indicators of past and future events

Representations
Alarm counters
View alarm counters as customizable tiles
Alarm list
View alarms and trigger actions
Maps
Visualize the status of different systems in map form
Metrology
Graph metrics received in Canopsis
Pattern ergonomics
Improving the autonomy of supervision pilots
Private views
Allow users to create their own views.
Reports / Queryers
Create and distribute reports based on all data produced by Canopsis
Rights management / Profiles
Easily assign one or more roles to a user
Root cause analysis
Identify the root cause of an alarm
Service weather
View alarms aggregated by service
Timeline makeover
Enhance timeline graphical interface
Widget templates
Creating presentation templates in Canopsis

Technical features
Authentification system
Benefit from a highly compatible authentication system
API
Integrate our solution into your ecosystem via a comprehensive and robust Canopsis API
Data-storage
Implement a data rotation policy
Event recording
Create and manage event recording in Canopsis (Amqp2tty graphical user interface)
Flow separation
Identify and categorize incoming feeds into Canopsis
Healthcheck
Be aware of Canopsis operating status
Horizontal scalability
Have a hypervision infrastructure adapted to the incoming load
Maintenance mode
Get a Maintenance mode when working on Canopsis
Performance benchmark
Compare performance between two versions
Resilience / High availability
Making the solution highly available (HA)
Canopsis as a service
Use Canopsis as a service (SaaS)
Smartfeeder
Test your Canopsis with an intelligent event generator
Support tool
Facilitate troubleshooting with Canopsis support team
Time zone management
Integrate time zones in a context of globally distributed IS