
Canopsis Pro
exclusivity
Active feature
since Canopsis 23.04
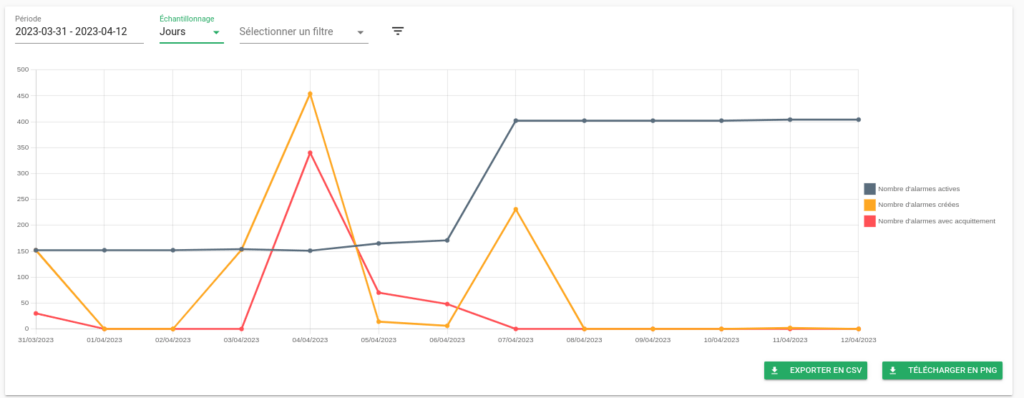
With the metrology widget, the idea is to be able to present a graph for each metric received on each alarm.
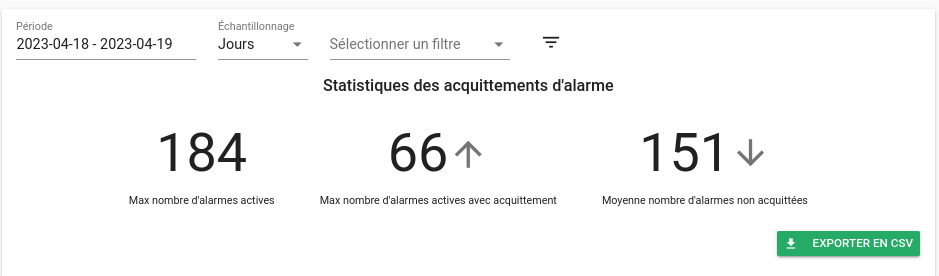
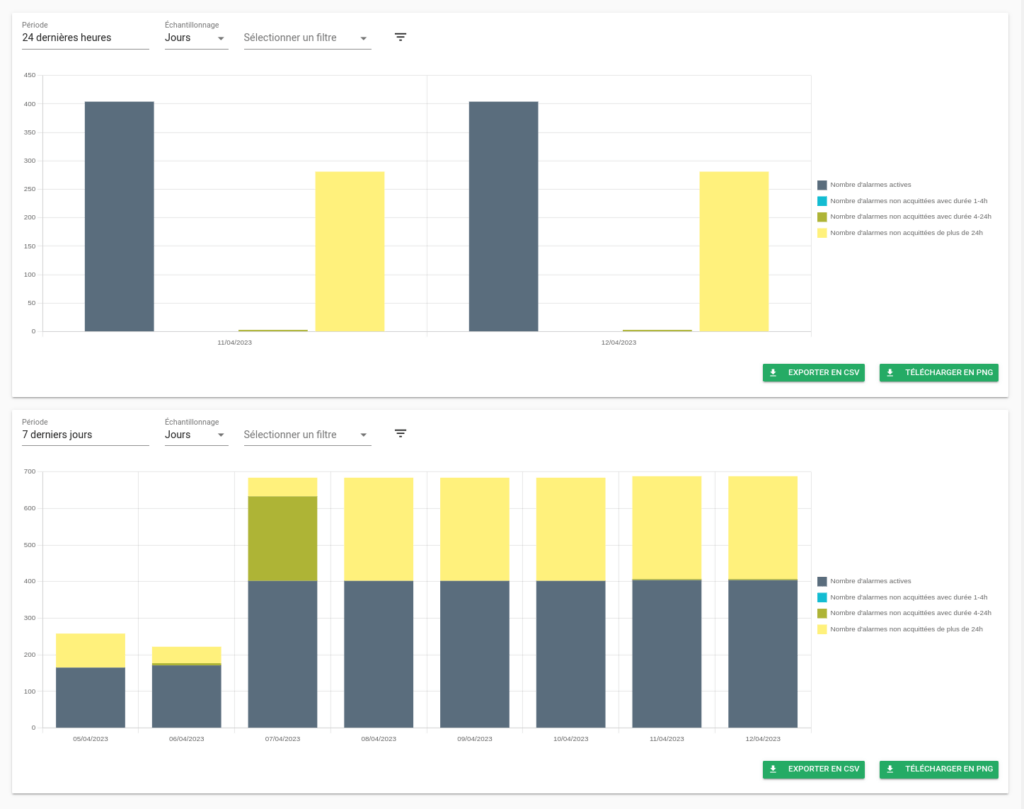
4 views are available:
- Pie chart / Pie chart: Visualizing proportions between different metrics
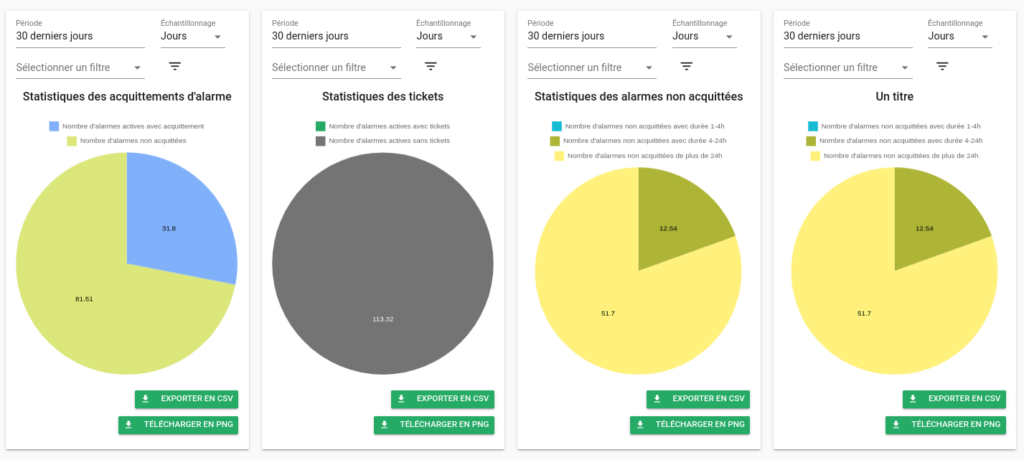
- Counters: Direct display of aggregated values for certain metrics
- Histogram: Visualization of values over a period, stacked or separated
- Online graph: Tracking the evolution of values over time
Eventually, we’ll be able to materialize anomalies on graphs thanks to the Temporal Analysis feature.
For more information on metrology and other features, visit the Canopsis documentation. You can also read our article on the release of Canopsis 23.04 and contact our technical team via the contact form.

Audience
- Supervision pilots
- Administrators
- Application managers

Added value
- Time saving
- Decision support
- Operational efficiency