

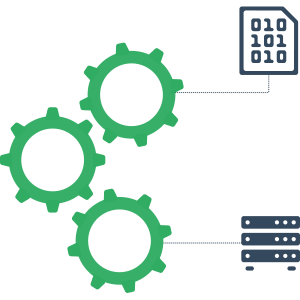
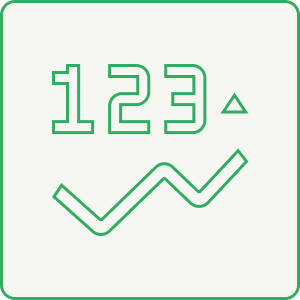
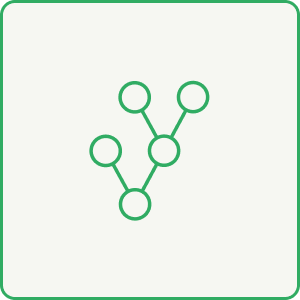
Aggregate
Massive centralization of events thanks to more than a hundred sources already connected: monitoring solutions, repositories, ITSM, CMDB, business applications, logs...
Interoperable by nature, our open source platform can easily absorb a wide variety of data!

Monitoring
tools
- High interoperability
- Simple exchange format
- Easy to develop connectors

Repositories /
ITSM / CMDB
- Regular or one-shot synchronization
- Automation function
- Basis of enrichment

Infrastructure tools /
Business Applications
- Databases, logs, snmp...
- Inbound API (events and enrichments)
- Reception and processing of app scenarios
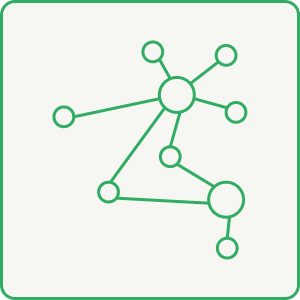
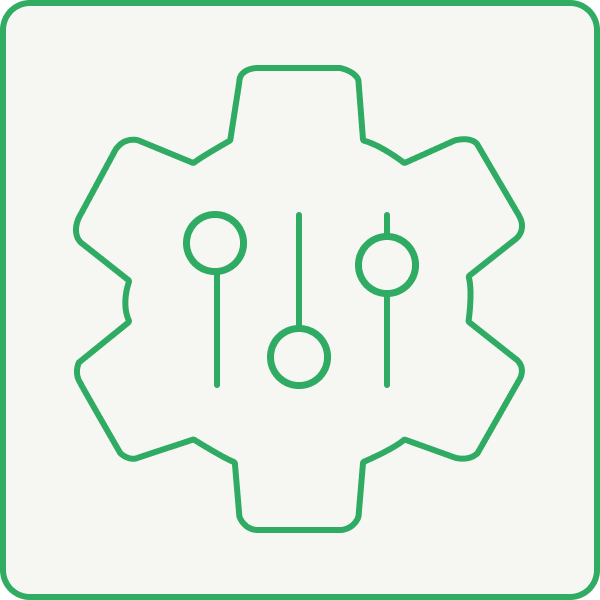
Process
Automatic, semi-automatic and user-triggered actions: enrichment, correlation, remediation, ticket creation...
In short, Canopsis offers innovative features for a high-performance IS with fewer operators!

Event filter
- Sorting of incoming events in Canopsis
- Data compliance
- Application firewall

Enrichment
- Event manipulation
- Entity transformation
- Repositories reconciliation

Planning
- Maintenance and service time-ranges
- Recurrence and exception date management
- Reduced number of alarms presented

Idle rules
- Data source lifeline management
- Reaction to the non-event notion
- Alarm support without
counter-alarm

Correlation
- Grouping alarms into meta-alarms
- Decrease in the number of alerts submitted
- Multi-criteria rules: time, attributes and quantity / percentage

Ticketing
- One ticket for one or more alarms
- Generic interconnection with third-party tools (webhooks)
- Customizable payloads

Dependency
tree
- Graphic representation of dependencies
- Trees, impact levels and priorities
- Prioritization of alarms for better SLA compliance

Scheduled
actions
- Assignment of several actions for a given alarm
- Complex scenario automation
- Customizable actions based on periodic behaviors (Planning)

Remediation
- Customed action plan for each alarm
- Rundeck, AWX and Jenkins connectors available
- Automated job and instruction execution

Link
generator
- Creating links to alarms
- Dynamic generation from variables
- 100% customizable links
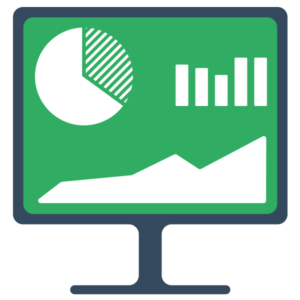
Restitute
Monitoring tools and dashboards in real and delayed time: Alarm list, service weather, maps, KPIs...
In short, an ergonomic interface that really makes life easier for teams!

Service
weather
- View alarms aggregated by service
- Worst case consideration
- IS modeling using dependency trees


Alarm
list
- Ergonomic display of collected information
- Customer process inspired life cycle
- Fully customizable views


Counters
- Alarm count based on predefined criteria
- Tailor-made filters
- Customizable restitution


Healthcheck
- Operating status of Canopsis and its components
- Interrogation by any monitoring tool
- Decision support in case of failover (HA)


KPIs
- Use of Canopsis valuation
- Real cost of an alarm determination
- Communication and team management help

")
Maps
- Quick visualization of the status of different systems
- Application and geographical maps
- 100 % customizable: colors, icons...


Entity SLI
- Calculation of uptime and downtime for each entity
- Prerequisites for the SLA feature


Metrology
- Representation of received metrics
- Dedicated graph for each alarm metric in various forms (counters, etc.)


Calendar
- Synthetic time view of alarm volume
- Quick identification of busy days

Notifications
- Real-time alerts via a visual reminder and a dedicated tab
- Proactive monitoring of critical events


Grafana
Generate alerts based on dashboard metrics

SNMP traps
Manage and monitor network and hardware problems with SNMP traps

Anomaly detection
Identify a malfunction by comparing periods

Chatbot 💡
Interact with a virtual conversation / chatbot agent
KPI / Return on investment 💡
Know the real cost of an alarm

Correlation 💡
Identify root causes and impacts
Alias system
Automatically rename entity information when it arrives in Canopsis
Context Explorer 💡
Display, filter, search and manipulate all entities

Data synergy with data sources
Enriching data sources
Dependency trees
Graphically represent IS dependencies
Enrichment
Enrich IS events as they arrive in Canopsis

Event filter
Sort events as they enter Canopsis
Patterns 💡
Dynamically filter all events and entities in Canopsis
Flapping
Identify alarms with fluctuating status

User interface / UI 💡
A clearer, more intuitive user interface

Idle rules
Manage Canopsis information source lifelines
Job manager
Viewing and managing jobs in Canopsis

Labels
Customize alarms with labels / tags

Link generator
Associating links with an entity or an alarm

Planning
Define monitoring periods and take into account changes impacting the operation

Remediation
Get automatically the most appropriate resolution method.

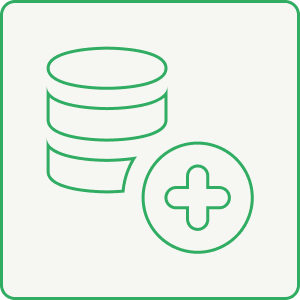
Import repositories
Improving data import into Canopsis
Scheduled actions
Give a given alarm several actions

Ticketing
Manage the ticket creation process directly in Canopsis using the ticketing module!

Unknown entity status
Quickly identify connected entities that cannot be reached during an incident
Webhooks
Send automated information flows to third-party tools in real time


Entity SLI
Calculate uptime and downtime for each entity
Metrics reception
Be able to receive metrics from third-party data sources

Alarm counters
View alarm counters as customizable tiles

Alarm list
View alarms and trigger actions

Calendar
View your alarm volume day by day
Notifications 💡
Inform users in real time via Canopsis notifications

Maps
Visualize the status of different systems in map form

Comment template
Create pre-filled fields to facilitate traceability and collaboration in Canopsis

Message broadcast
Communicate information via a banner on the Canopsis interface

Private views
Allow users to create their own views.

Rights management / Profiles
Easily assign one or more roles to a user
Root cause analysis
Identify the root cause of an alarm

Service weather
View alarms aggregated by service
Timeline makeover
Enhance timeline graphical interface

Widget templates
Creating presentation templates in Canopsis


Authentification
Benefit from a highly compatible authentification system
Template studio
Preview your Go and Handlebars templates in real time during editing
Data-storage
Implement a data rotation policy

Event recording
Create and manage event recording in Canopsis (Amqp2tty graphical user interface)

External authentication tokens
Facilitate management of secure connections with third-party services
Flow separation
Identify and categorize incoming feeds into Canopsis

Healthcheck 💡
Be aware of Canopsis operating status

Maintenance mode
Maintenance mode when working on Canopsis

Resilience / High availability
Making the solution highly available (HA)

Smartfeeder
Test your Canopsis with an intelligent event generator

Support tool
Facilitate troubleshooting with Canopsis support team


EUE scenarios
Receive and process End-User Experience scenario results