

Available on Canopsis
Pro and Community
Active feature
since Canopsis V4.3
The Dependency Tree feature models IS services graphically, with different levels of impact and multiple priorities.
From now on, the Maps module can display the prioritization of alarms. alarms via a dependency tree, while ensuring better compliance with SLAs.
Here is an example of rendering: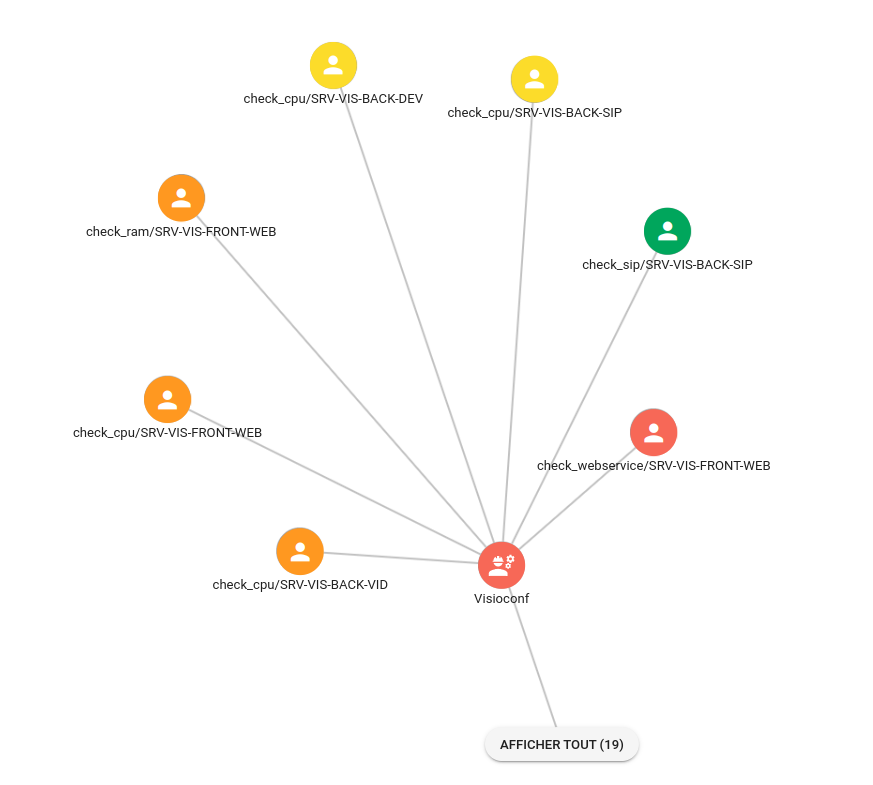
For more information on the Dependency Trees module, visit our dedicated article and the Canopsis documentation.
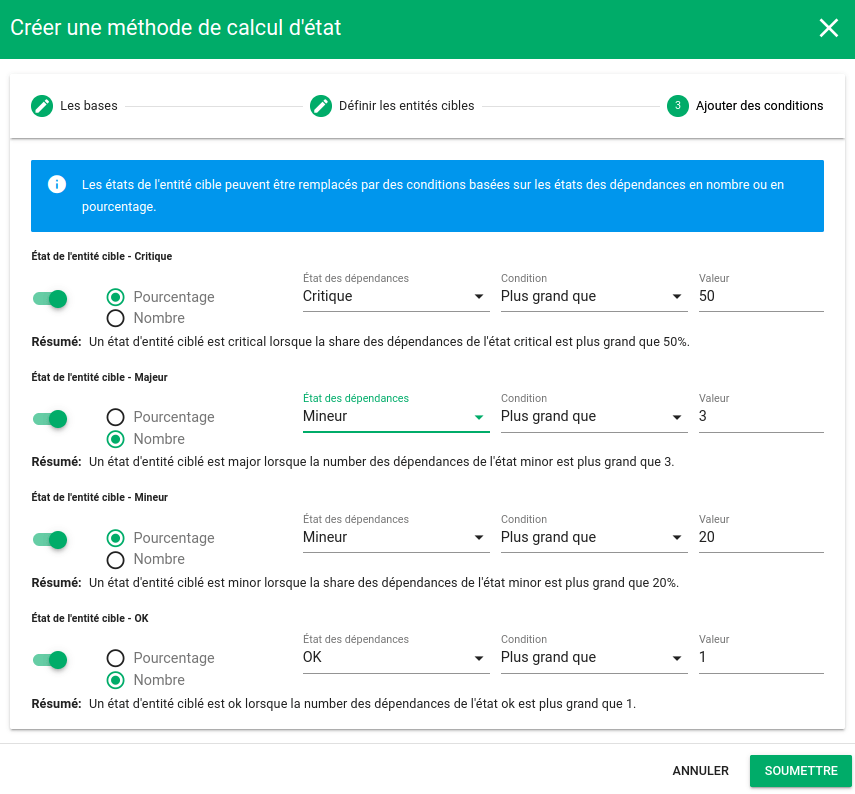
✅ Update 2024: New state calculation algorithms available
Algorithms for calculating service states, to create additional rules to the “worst state” rule. They are of two types:
- State is inherited from dependency(ies) responsible for final state
- State is defined by a share or number of dependencies of a specific state
Any unanswered questions? You can also contact our technical team via the contact form.

Audience
- Supervision pilots
- Application managers

Added value
- Relevance
- Decision support
- Operational efficiency