

Available on Canopsis
Community and Pro
Active feature
since Canopsis V1
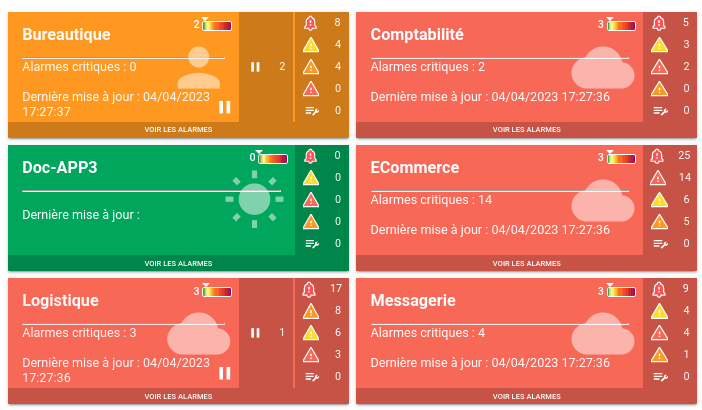
Based on the notion of service, weather represents aggregated states. A service is modeled as adependency tree on which a worst-case algorithm is applied.
The views are in the form of tiles, on which all the information needed to understand the audience is displayed.
For more information on service weather and other features, visit the Canopsis documentation. Any unanswered questions? You can also contact our technical team via the contact form.
✅ Update 2023: Additional displays on the service weather module
Additional indicators can now be displayed directly on service weather tiles.
These indicators show:
- entity severity levels,
- entities associated with periodic behavior,
- paid and unpaid entities.
These counters can also be used in Handlebar templates.
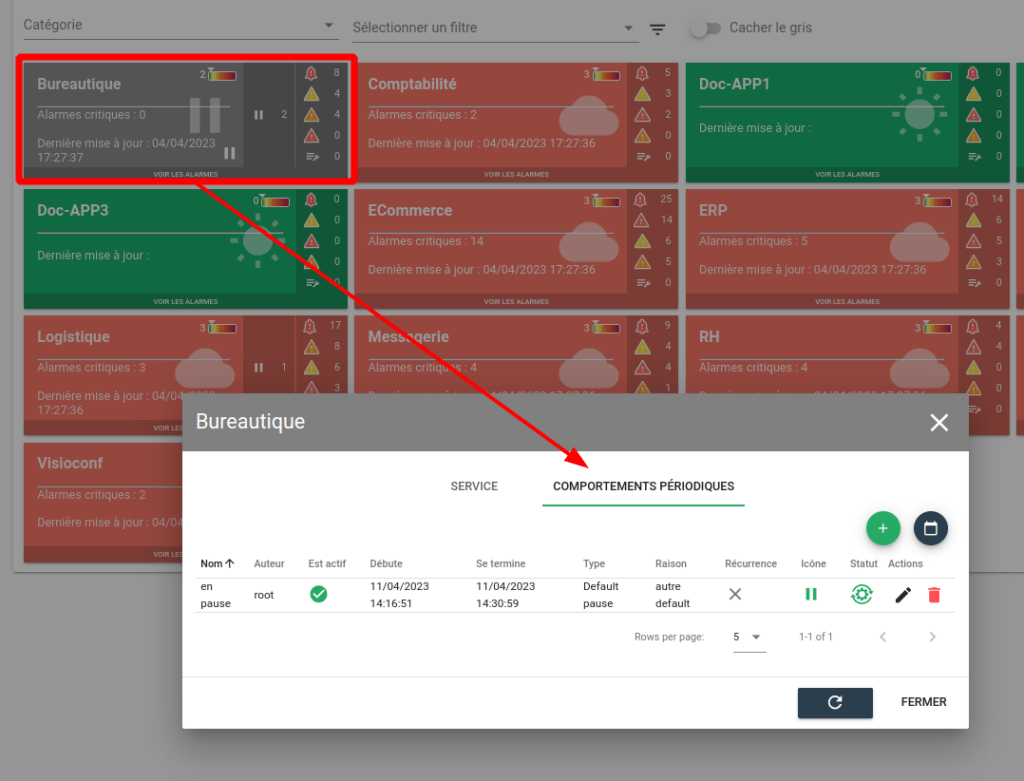
In addition, a new tab dedicated to periodic behavior has been added to the modal window of service weather tiles, offering a more detailed view of this information:
✅ Update 2024: Addition of new service status calculation algorithms
- Boolean expressions applied to entities
- Percentage of severity
- Number of associated alarms…

Audience
- Supervision pilots
- Application managers

Added value
- Relevance
- Decision support
- Operational efficiency