

Canopsis Pro
exclusivity
Active feature
since Canopsis V24.10
When a Canopsis support case arises in your IT ecosystem, several avenues can be explored and, among others, you are asked to consult:
- The engine logs: Logs that contain all changes of management rules within Canopsis.
- The latest changes made to management rules (TimescaleDB table “Action_logs.”): Logs that contain all the changes to periodic behaviors, eventfilter rules, scenarios…
- The status of RabbitMQ bus queues: Retrieval of RabbitMQ-specific metrics relies (for the moment) on a third-party service, Prometheus
- The database information: By default, these database dumps contain all the data contained in your databases
With the Canopsis Support Tool, you can now:
- Export MongoDB and TimescaleDB data
- Export technical metrics
- Export RabbitMQ-specific metrics via Prometheus (see above)
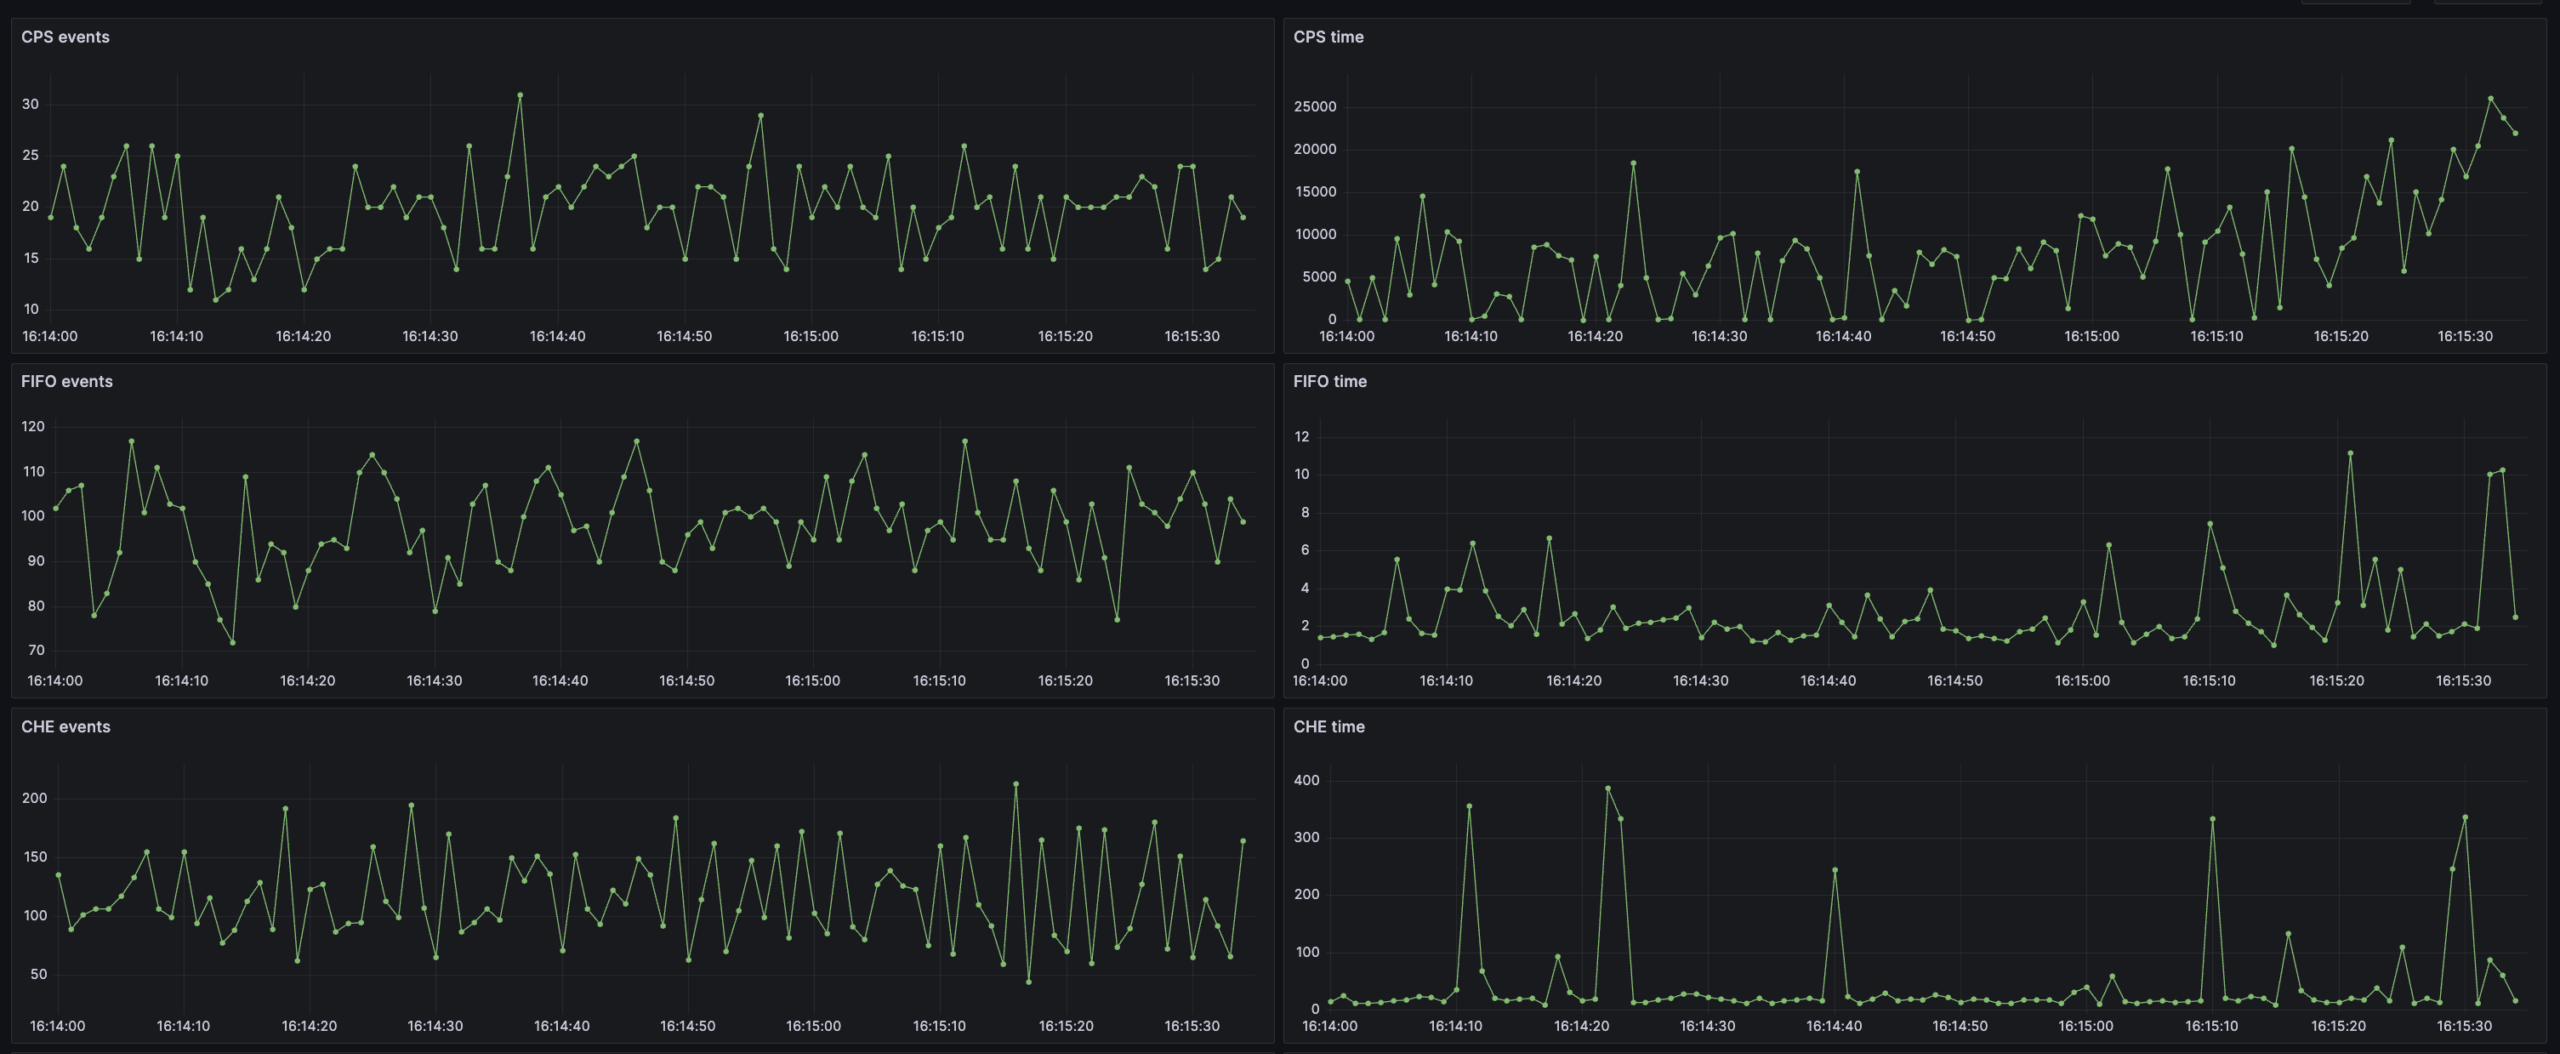
- View exported data in the form of Grafana dashboards
For more technical information on the support tool and all other Canopsis features, please visit our documentation page.
If any unanswered questions remain, you can also contact our team via the contact form.

Public
- Administrators

Added value
- Continuous improvement
- Time saving