In an IT context where the volume of information is exploding, a powerful metrics tool is essential. But traditional monitoring methods sometimes struggle to provide sufficiently granular and responsive visibility. It is in this context that Prometheus stands out as a cornerstone of modern observability.
In this article, we take a technical look at Prometheus, its strengths and uses. We’ll also look at the advantages of combining it with our open-source hypervisor solution, Canopsis.
Solution overview
Prometheus is an open source monitoring solution focused on time-series metrics. Initiated in 2012 at SoundCloud, it subsequently became a key component of the Cloud Native ecosystem. In 2016, this initiative joined the Cloud Native Computing Foundation (CNCF).
Its main architectural principles are :
- Time series database: The tool stores metrics associated with timestamps, often enriched with tags.
- Pull” collection model: Prometheus periodically polls HTTP exposure points (/metrics) on applications or exporters. This ensures precise collection control and consistent data.
- PromQL: This rich language lets you formulate complex queries to aggregate, filter and correlate metrics.
- Integrated Alerting: Prometheus integrates an alarm system, Alertmanager, capable of :
- Manage suppression of redundant alerts,
- Define conditions,
- Send notifications according to rules,
- And to regroup.
Prometheus relies on a multitude of exporters to capture and monitore metrics from each layer:
- infrastructure (servers, OS)
- application services,
- databases,
- network…
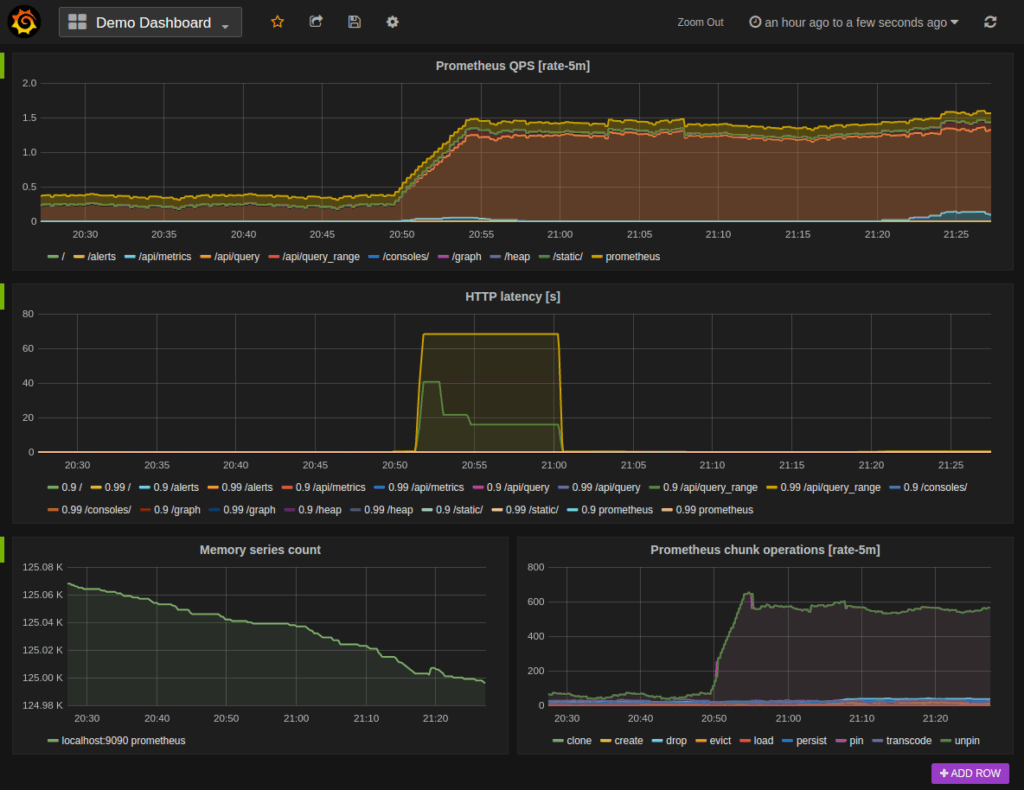
In most cases, it also integrates with Grafana to visualize and build interactive dashboards for IT monitoring:
Prometheus technical and functional benefits
Here’s what Prometheus brings to the table, over and above its core capabilities of monitoring.
Technical advantages
- Flexibility and multi-dimensionality
The use of labels enables metrics to be sorted, aggregated and broken down along various axes (instance, version, region, service type). Very useful for distributed infrastructures!
- Scalability and modularity
Prometheus is lightweight by nature. However, it can be scaled up via federated architectures, clusters, remote write or third-party ingestion components. Analysts, operators and engineers can therefore distribute loads according to geographical zones or functions.
- Alert accuracy
Thanks to the combination of fast local storage, fine-tuned alert rules and low collection latency, Prometheus provides early, reliable alerts.
- Interoperability and integrations
Many platforms integrate with Prometheus to ingest or export metrics. For example, Elastic offers a Prometheus integration that enables metrics to be collected via exporters, Remote-Write or PromQL queries.
Functional advantages
- Near real-time visibility
For mission-critical operations, being able to observe CPU load, latency and application or infrastructure errors in near-real time is a strategic advantage!
- Versatile use cases
- Monitoring of physical or virtual infrastructures
- Container / Kubernetes monitoring
- Business application monitoring (response times, errors)
- IoT and embedded devices (with certain limits depending on frequency and cardinality)
- Proactive incident prevention
- Visualizing and exploring trends
Dashboards (Grafana or others) can also be used to analyze trends, forecast peak loads, detect anomalies, manage capacity or model performance for SLAs.
- Cost reduction
Open source = no license fees. The cost is in sizing (storage, instances), but the flexibility enables optimized use.
What Prometheus can do in combination with Canopsis
Now that we’ve seen what Prometheus is and its strengths, let’s look at what we can achieve by combining it with our open-source hypervisor solution like Canopsis.
Synergy between events and metrics
Canopsis aggregates events from supervisors, repositories, logs, CMDB… Prometheus provides continuous metrics: latency, error rates and resource utilization.
By combining the two, we can not only detect alerts via Canopsis, but also have access to the metric context that generated them, enabling faster diagnosis.
Prometheus connector for Canopsis
Prometheus, coupled with Alertmanager, generates alarms that are received by the dedicated Canopsis connector. It takes the form of an Alertmanager webhook receiver. Received webhooks are transformed into Canopsis events.
Real-life use cases
- Accelerated incident diagnosis: an alert triggered in Canopsis can display, in its panel, associated metrics thanks to Prometheus – input latency, CPU/memory on relevant services, intermittent errors.
- KPIs / business trends: collection of business metrics exposed via Prometheus and integration into Canopsis for reporting, dashboards, service environments, impact maps.
- Noise reduction / false alarms: metrics to check whether an alarm is due to a temporary spike/bottleneck or whether it’s really a stable problem, and Canopsis can filter according to these metrics.
- Automation / remediation: Prometheus alerts → Canopsis → triggering automatic or semi-automatic actions or workflows, tickets, escalations according to indicators.
- Correlation: Prometheus alerts are aggregated in the unique Canopsis console, enabling alarms received to be confirmed or denied by applying correlation rules.
Benefits for Canopsis users
- Complete IS vision: metrics + alarms + logs + repositories in a single management layer.
- Reduce false positives/false alarms: by combining metrics (e.g. load or error rate) and events, we can avoid alerting you to temporary or insignificant incidents.
- Improved responsiveness: the operation has a centralized alarm database (Canopsis) enriched with real-time metrics, facilitating rapid decision-making.
- History, reporting, powerful KPIs: with Prometheus as a reliable metric source, Canopsis can offer more robust reports, comparisons over time, capacity analyses…
To conclude on Prometheus monitoring… and Canopsis!
Prometheus is therefore an extremely powerful monitoring tool for collecting, storing and querying high-frequency metrics, via exporters. With Alertmanager, its alarms can be transmitted to a hypervision tool like Canopsis, which will reduce the “noise”, thus avoiding drowning users in irrelevant alarms.
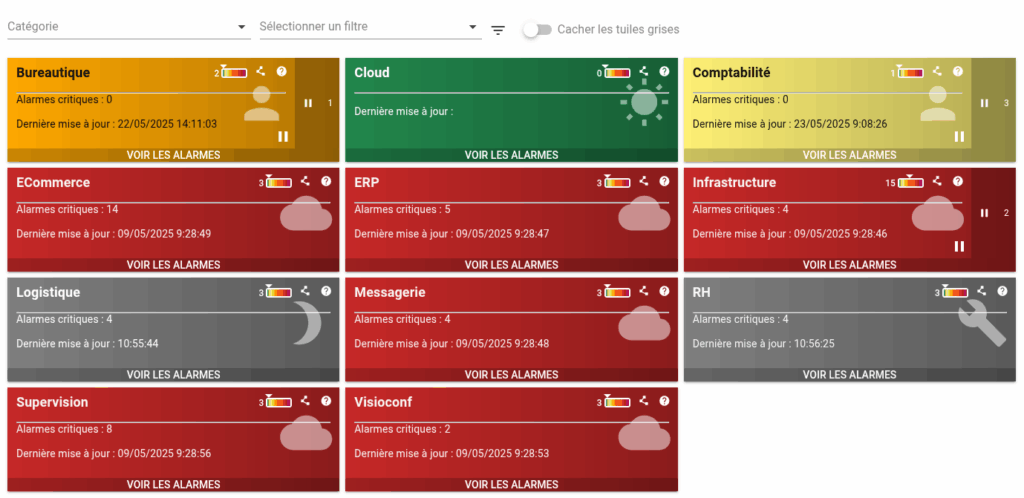
From Prometheus metrics to Canopsis service weather: the Prometheus connector helps to calculate service weather business indicators, by combining the metrics received with other sources of information.
If you use Canopsis, Prometheus integration is a natural step for :
- gain granular visibility,
- diagnose faster,
- reduce downtime,
- improve internal/external user satisfaction.
Want to find out more about what Prometheus and Canopsis can do for your IS? Come and talk to our Open Source experts!